
Options trading has become one of the most powerful ways for traders in India to generate consistent profits. But if you want to succeed as an intraday trader, option buyer, or seller, you must learn how to interpret call and put strike prices along with open interest (OI). These factors act like a roadmap of market psychology, showing where big traders, institutions, and smart money are placing their bets.
In this blog, we’ll explain in simple, practical terms how to analyze call and put strike prices with open interest as support and resistance levels. Whether you’re a beginner exploring stock market courses in Lucknow or an experienced trader searching for advanced strategies, this guide will boost your confidence and accuracy.
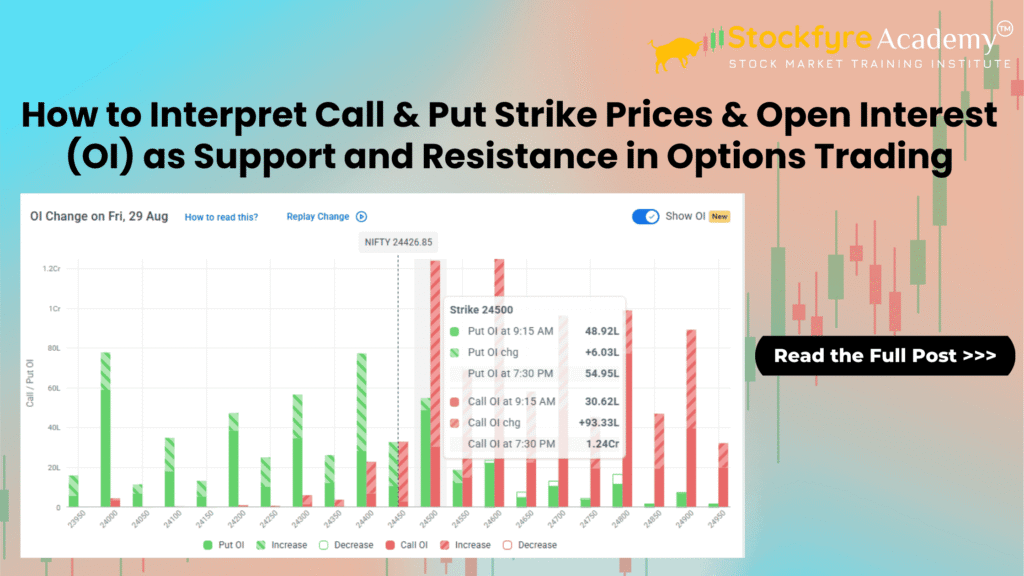
What is Open Interest (OI) in Options?
Open Interest (OI) is the total number of outstanding option contracts (both calls and puts) that are not yet settled. Unlike volume, OI gives you a clearer picture of market positions and trader sentiment.
Rising OI + Rising Price = Bullish trend
Rising OI + Falling Price = Bearish trend
Falling OI + Rising Price = Short covering
Falling OI + Falling Price = Long unwinding
How Call & Put Strike Prices Act as Support & Resistance
Options strike prices, combined with OI data, help traders predict strong price levels where the market is likely to reverse or consolidate.
Put OI = Support Zone
When traders sell Put Options, they expect the market to stay above a certain level.
Higher Put OI at a strike price = Strong support.
Example: If Nifty is at 25,000 and Put OI is maximum at 24,800, then 24,800 becomes a support level.
Call OI = Resistance Zone
When traders sell Call Options, they expect the market to stay below a certain level.
Higher Call OI at a strike price = Strong resistance.
Example: If Nifty is at 25,000 and Call OI is maximum at 25,200, then 25,200 becomes a resistance level.
Live Example with Nifty at 25,000
Maximum Put OI = 24,800 → Support.
Maximum Call OI = 25,200 → Resistance.
Interpretation: Nifty is expected to trade between 24,800 – 25,200 range unless a breakout happens.
Why OI Acts as Support & Resistance?
Call Writers (Sellers) believe prices won’t cross that strike level → They create resistance.
Put Writers (Sellers) believe prices won’t fall below that strike → They create support.
This is why high Call OI = ceiling and high Put OI = floor of the market.
Step-by-Step Guide to Interpret OI Data
Check Nifty’s Current Price (Spot Level) Example: Nifty is at 25,000.
Look at Call OI Data (Above Current Price)
Identify strikes with highest Call OI → Strong Resistance.
Example: 25,200 CE → OI = 22 lakh and 25,300 CE → OI = 28 lakh (Highest Resistance)
Look at Put OI Data (Below Current Price)
Identify strikes with highest Put OI → Strong Support.
Example: 24,800 PE → OI = 20 lakh and 24,700 PE → OI = 25 lakh (Strongest Support)
Check OI Change (Day’s Build-up)
If Call OI increases → Resistance is getting stronger.
If Put OI increases → Support is getting stronger.
If OI unwinds (decreases) → That level is weakening.
Example: Nifty at 25,000
| Strike Price | Call OI (in Lakh) | Put OI (in Lakh) | Interpretation |
|---|---|---|---|
| 24,700 PE | – | 25 | Strong Support |
| 24,800 PE | – | 20 | Support Zone |
| 25,000 ATM | 15 | 12 | Tug of War |
| 25,200 CE | 22 | – | Resistance Zone |
| 25,300 CE | 28 | – | Strong Resistance |
Analysis:
Strongest support = 24,700
Strongest resistance = 25,300
Market likely to trade in 24,700 – 25,300 range unless big news/event breaks.
How Traders Use This in Real Market
Range-bound strategy: If Nifty is consolidating between support & resistance, traders can use short straddles/strangles.
Breakout trading: If Nifty breaks 25,300 with heavy volumes & OI unwinding on calls, expect an uptrend.
Breakdown trading: If Nifty falls below 24,700 with heavy volumes & OI unwinding on puts, expect a downtrend.
How Traders Use This in Real Market
Intraday Trading:
If the market opens near support (Put OI) and moves up, traders go long.Breakout Strategy:
If the index closes above Call OI resistance, it signals bullish breakout.Positional View:
Watching OI shifts daily helps spot trend changes early.
Why Learning OI Analysis is Crucial for Traders
Reduces random guessing in trading.
Improves risk management.
Helps you understand where big money is flowing.
Boosts confidence in entry/exit decisions.
At Stockfyre – the best stock market institute in Lucknow, we simplify such professional strategies in our offline and online stock market training programs so that you can trade with clarity, not confusion.
FAQ – Call, Put & OI as Support and Resistance
Q1. Can beginners use OI data for intraday trading?
Yes. Even beginners can learn OI basics quickly and use them for better trading accuracy.
Q2. Is OI more reliable than technical indicators?
OI reflects real market positioning by big players, making it more reliable than many lagging indicators.
Q3. Does OI work for both stocks and index options?
Yes. OI can be used for Nifty, Bank Nifty, and even individual stock options.
Q4. What if OI data changes during market hours?
Track intraday changes. A sudden spike in OI often signals a trend shift.
Q5. Where can I learn this in detail?
Join our online & offline stock market courses in Lucknow at Stockfyre to master OI analysis and more.
Conclusion
Understanding call & put strike prices and open interest (OI) as support and resistance is a game-changer in options trading. It gives traders a clear edge by aligning with the strategies of big institutional players.
At Stockfyre, we don’t just teach theory—we train you to apply these concepts in real trades. Whether you are a beginner or an advanced trader, our courses are designed to help you become a confident, consistent, and profitable trader.

Start Your Trading Journey with Stockfyre Academy
Join Stockfyre Academy — India’s Trusted Stock Market Training Institute Online + Offline Classes | NISM & NSE-Certified Trainers
- From Basics to Advanced Trading Strategies
- Live Market Training | 1-Year Mentorship
- Learn Smart. Trade Confident. Grow Wealthy.

Sushil Chauhan is the Founder & Mentor at Stockfyre Academy, a NISM-Certified Research Analyst and NSE Certified Trainer. He has also worked with prominent stock broking firms such as Angel One and ICICI Direct Ltd. With strong practical market experience, he has guided thousands of traders and investors across India through structured, education-first stock market learning focused on real market understanding and discipline.